jqPlot主要仰賴jQuery來實現功能,算是一個蠻好上手的js套件
可以看一下API在開始下手
先從官方範例的程式碼研究,以下是第一個範例程式碼
$(document).ready(function(){
  var plot1 = $.jqplot ('chart1', [[3,7,9,1,4,6,8,2,5]]);
});
我們先看一下jplot constructor
- 對象
- 資料
- 選項
再回去看上面的程式碼,就可以知道我們的目標是『chart1』,資料為[3,7,9,1,4,6,8,2,5],結果如下:

在看第二個範例程式碼
$(document).ready(function(){
  var plot2 = $.jqplot ('chart2', [[3,7,9,1,4,6,8,2,5]], {
      // Give the plot a title.
      title: 'Plot With Options',
      // You can specify options for all axes on the plot at once with
      // the axesDefaults object.  Here, we're using a canvas renderer
      // to draw the axis label which allows rotated text.
      axesDefaults: {
        labelRenderer: $.jqplot.CanvasAxisLabelRenderer
      },
      // An axes object holds options for all axes.
      // Allowable axes are xaxis, x2axis, yaxis, y2axis, y3axis, ...
      // Up to 9 y axes are supported.
      axes: {
        // options for each axis are specified in seperate option objects.
        xaxis: {
          label: "X Axis",
          // Turn off "padding".  This will allow data point to lie on the
          // edges of the grid.  Default padding is 1.2 and will keep all
          // points inside the bounds of the grid.
          pad: 0
        },
        yaxis: {
          label: "Y Axis"
        }
      }
    });
});
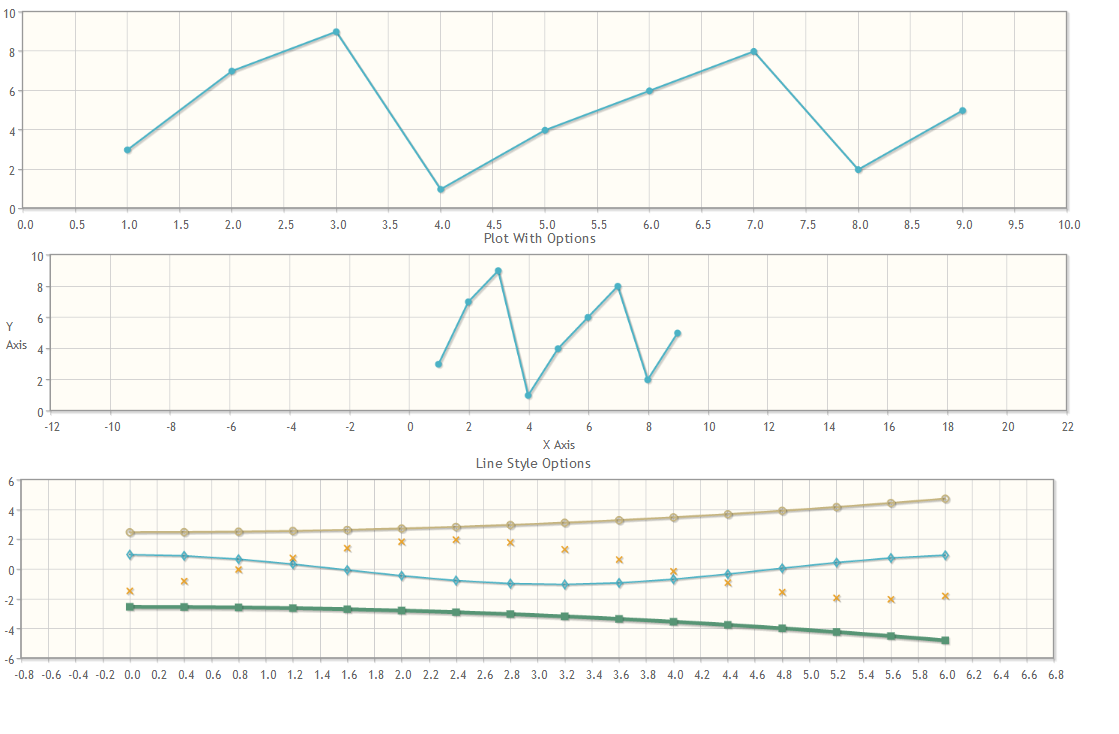
將目標是『chart2』,資料為[[3,7,9,1,4,6,8,2,5]]
設定標題以及X與Y軸的標籤,並將間距設定為0,預設值為1.2,結果如下

比較一下上面X間距是0,而下面X間距是4

第三個範例程式碼如下:
$(document).ready(function(){
  // Some simple loops to build up data arrays.
  var cosPoints = [];
  for (var i=0; i<2*Math.PI; i+=0.4){
    cosPoints.push([i, Math.cos(i)]);
  }

  var sinPoints = [];
  for (var i=0; i<2*Math.PI; i+=0.4){
     sinPoints.push([i, 2*Math.sin(i-.8)]);
  }

  var powPoints1 = [];
  for (var i=0; i<2*Math.PI; i+=0.4) {
      powPoints1.push([i, 2.5 + Math.pow(i/4, 2)]);
  }

  var powPoints2 = [];
  for (var i=0; i<2*Math.PI; i+=0.4) {
      powPoints2.push([i, -2.5 - Math.pow(i/4, 2)]);
  }

  var plot3 = $.jqplot('chart3', [cosPoints, sinPoints, powPoints1, powPoints2],
    {
      title:'Line Style Options',
      // Series options are specified as an array of objects, one object
      // for each series.
      series:[
          {
            // Change our line width and use a diamond shaped marker.
            lineWidth:2,
            markerOptions: { style:'dimaond' }
          },
          {
            // Don't show a line, just show markers.
            // Make the markers 7 pixels with an 'x' style
            showLine:false,
            markerOptions: { size: 7, style:"x" }
          },
          {
            // Use (open) circlular markers.
            markerOptions: { style:"circle" }
          },
          {
            // Use a thicker, 5 pixel line and 10 pixel
            // filled square markers.
            lineWidth:5,
            markerOptions: { style:"filledSquare", size:10 }
          }
      ]
    }
  );
});
目標是『chart3』,資料則是[cosPoints, sinPoints, powPoints1, powPoints2]陣列,將每條線設定成不一樣的形狀去表示,結果如下

全部程式碼如下:
<!DOCTYPE html>
<html>
<head>
 <meta charset="utf8">
 <script language="javascript" type="text/javascript" src="jquery-2.0.3.min.js"></script>
 <script language="javascript" type="text/javascript" src="jquery.jqplot.min.js"></script>
 <script language="javascript" type="text/javascript" src="jqplot.logAxisRenderer.js"></script>
 <link rel="stylesheet" type="text/css" href="jquery.jqplot.css" />
 <title>test</title>
</head>
<body>
 <script type="text/javascript">
  $(function () {
   $.jqplot ('test1', [[3,7,9,1,4,6,8,2,5]]);

   $.jqplot ('test2', [[3,7,9,1,4,6,8,2,5]], {
         title: 'Plot With Options',
       axesDefaults: {
        labelRenderer: $.jqplot.CanvasAxisLabelRenderer
       },
       axes: {
           xaxis: {
             label: "X Axis",
             pad: 4
           },
           yaxis: {
             label: "Y Axis",
           }
       }
   });

   // Some simple loops to build up data arrays.
     var cosPoints = [];
     for (var i=0; i<2*Math.PI; i+=0.4){
       cosPoints.push([i, Math.cos(i)]);
     }

     var sinPoints = [];
     for (var i=0; i<2*Math.PI; i+=0.4){
        sinPoints.push([i, 2*Math.sin(i-.8)]);
     }

     var powPoints1 = [];
     for (var i=0; i<2*Math.PI; i+=0.4) {
         powPoints1.push([i, 2.5 + Math.pow(i/4, 2)]);
     }

     var powPoints2 = [];
     for (var i=0; i<2*Math.PI; i+=0.4) {
         powPoints2.push([i, -2.5 - Math.pow(i/4, 2)]);
     }

   $.jqplot('test3', [cosPoints, sinPoints, powPoints1, powPoints2],
    {
         title:'Line Style Options',
         // Series options are specified as an array of objects, one object
         // for each series.
         series:[
             {
               // Change our line width and use a diamond shaped marker.
               lineWidth:2,
               markerOptions: { style:'dimaond' }
             },
             {
               // Don't show a line, just show markers.
               // Make the markers 7 pixels with an 'x' style
               showLine:false,
               markerOptions: { size: 7, style:"x" }
             },
             {
               // Use (open) circlular markers.
               markerOptions: { style:"circle" }
             },
             {
               // Use a thicker, 5 pixel line and 10 pixel
               // filled square markers.
               lineWidth:5,
               markerOptions: { style:"filledSquare", size:10 }
             }
         ]
       }
   );
  });
 </script>
 <div id="test1"></div>
 <div id="test2"></div>
 <div id="test3"></div>
</body>
</html>
結果如下:
參考資料:
http://www.jqplot.com/tests/line-charts.php
http://www.jqplot.com/docs/files/jqplot-core-js.html
http://www.jqplot.com/docs/files/jqplot-core-js.html#$.jqplot
http://www.jqplot.com/docs/files/jqplot-core-js.html#Title
http://www.jqplot.com/docs/files/jqplot-core-js.html#Axis.label
http://www.jqplot.com/docs/files/jqplot-core-js.html#Series
http://lamb-mei.com/284/jquery-min-map-404-not-found/